May 01: India’s gross expenditure in R&D has tripled between 2008 & 2018 driven mainly by the Govt sector and scientific publications have risen placing the country internationally among the top few. This is as per the R&D Statistics and Indicators 2019-20 based on the national S&T survey 2018 brought out by the National Science and Technology Management Information (NSTMIS), Department of Science and Technology (DST).
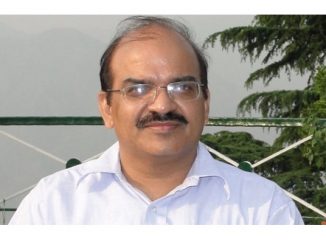
“The report on R&D indicators for the nation is an extraordinarily important document for the evidence-based policymaking and planning in higher education, R&D activities and support, intellectual property, and industrial competitiveness. While it is heartening to see substantial progress in the basic indicators of R&D strengths such as the global leadership in the number of scientific publications, there are also areas of concern that need strengthening,” said Prof Ashutosh Sharma, Secretary, DST
The report shows that with the rise in publication, the country is globally at the 3rd position on this score as per the NSF database, 3rd in the number of Ph.D. in science & engineering. The number of researchers per million population has doubled since 2000.
The report captures the R&D landscape of the country through various Input-Output S&T Indicators in the form of Tables and graphs. These pertain to Investments in national R&D, R&D investments by Government and Private sector; R&D relationship with the economy (GDP), Enrolment of S&T personnel, Manpower engaged in R&D, Outrun of S&T personnel, papers published, patents and their international S&T comparisons.
The survey included more than 6800 S&T Institutions spread across varied sectors like central government, state governments, higher education, public sector industry, and private sector industry in the country, and a response rate of more than 90% was achieved.
Some of the key findings of the report are the following:
India’s gross expenditure in R&D has tripled between 2008 & 2018
- The Gross expenditure on R&D (GERD) in the country has been consistently increasing over the years and has nearly tripled from Rs. 39,437.77 crore in 2007- 08 to Rs. 1,13,825.03 crore in 2017-18.
- India’s per capita R&D expenditure has increased to PPP $ 47.2 in 2017-18 from PPP $ 29.2 in 2007-08.
- India spent 0.7% of its GDP on R&D in 2017-18, while the same among other developing BRICS countries were Brazil 1.3%, Russian Federation 1.1%, China 2.1% and South Africa 0.8%.
Extramural R&D support by central S&T agencies has increased significantly
- DST and DBT were the two major players contributing 63% and 14%, respectively of the total extramural R&D support in the country during 2016-17.
- Women participation in extramural R&D projects has increased significantly to 24% in 2016-17 from 13% in 2000-01 due to various initiatives undertaken by the Government in the S&T sector
- As on 1st April 2018, nearly 5.52 lakh personnel were employed in the R&D establishments in the country
The number of researchers per mn populations has doubled since 2000
- The number of researchers per million population in India has increased to 255 in 2017 from 218 in 2015 and 110 in 2000.
- India’s R&D expenditure per researcher was 185 (‘000 PPP$) during 2017-18 and was ahead of the Russian Federation, Israel, Hungary, Spain and UK.
- India occupies 3rd rank in terms of the number of Ph. D.’s awarded in Science and Engineering (S&E) after USA (39,710 in 2016) and China (34,440 in 2015).
India is placed 3rd among countries in scientific publication as per NSF database
- During 2018, India was ranked at 3rd, 5th and 9th in scientific publication output as per the NSF, SCOPUS and SCI database respectively
- During 2011-2016, India’s growth rate of scientific publication as per the SCOPUS and SCI database was 8.4% and 6.4% as against the world average of 1.9% and 3.7%, respectively.
- India’s share in global research publication output has increased over the years as reflected in publication databases
India is ranked at 9th position in terms of Resident Patent Filing activity in the world
- During 2017-18 a total of 47,854 patents were filed in India. Out of which, 15,550 (32%) patents were filed by Indian residents
- Patent applications filed in India are dominated by disciplines like Mechanical, Chemical, Computer/Electronics, and Communication.
- According to WIPO, India’s Patent Office stands at the 7th position among the top 10 Patent Filing Offices in the world.
Source: PIB
Disclaimer: We donot claim that the images used as part of the news published are always owned by us. From time to time, we use images sourced as part of news or any related images or representations. Kindly take a look at our image usage policy on how we select the image that are used as part of the news.


