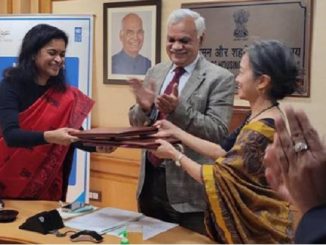
Nov 26: UNDP and Invest India has launched the SDG Investor Map for India, laying out 18 Investment Opportunities Areas (IOAs) in six critical SDG enabling sectors, that can help India push the needle forward on Sustainable Development.
“India occupies a key role in determining the success of the SDGs, globally. Invest India is pleased to have partnered with UNDP India to develop the first-ever ‘SDG Investor Map for India’. This initiative is an instrumental stride in India’s development trajectory, and I believe it couldn’t have come at a better time. We hope our data-backed research and insights serve as useful blueprints to understand how best the SDG financing gap can be narrowed in India”, Mr. Deepak Bagla, CEO & MD, Invest India, said on the launch occasion.
Mr Shoko Noda, Resident Representative, UNDP India said on the occasion, “The Map comes at a critical time for India. With the emergence of the COVID-19 pandemic, the financing gap for the SDGs in India has only widened further and decades of development progress is nearly on the verge of reversal. Investing in the SDGs at this point is crucial to ‘Building Back Better’ and making the economy and our societies more resilient and sustainable. Enhanced productivity, technology adoption and increased inclusion are all critical factors that this map uses to identify the most attractive sectors for investors.”
Key highlights of the SDG Investor Map:
- Of the 18 IOAs identified, 10 are already mature investable areas that have seen robust Private Equity and Venture Capital activity, and feature companies that have been able to unlock scale and demonstrate profitability. The remaining eight IOAs are emerging opportunities, which have seen traction from early-stage investors.
- The map has also identified eight White Spaces, which have seen investor interest and have the potential to grow into IOAs within a 5-6-year horizon. However, these require further policy support and private sector participation to mature into commercially attractive IOAs.
- Nearly 50% of the shortlisted IOAs have historical investments that have yielded IRRs in excess of 20%.
- 84% of the IOAs have investment timeframes ranging from the short term (less than 5 years) to the medium-term (between 5- 15 years).
The observations from the map present a strong case for investing in SDG enabling sectors and IOAs, bridging the gap between high-level development targets and the need for commercially viable returns. Moreover, investing in the SDGs is crucial to ‘Building Back Better’ from COVID-19 and enhancing India’s resilience to future threats. Investing in opportunities that enhance employment and employability, push forward the inclusion of underserved communities and leverage technology will be of essence to India as it grapples with the challenges of a post-COVID economy.
83% of the identified IOAs address job creation and industrialization needs, 70% focus on inclusive business models and 50% leverage digital technologies to deliver commercial returns and impact at scale. Notable IOAs include ‘Online Supplementary Education for K12’ (Education), ‘Tech-Enabled Remote Care Services’ (Healthcare), ‘Digital Platforms to service input/output needs of farmers to enable easy access to markets’ (Agriculture) and ‘Access to credit by Micro, Small and Medium Enterprises and Low-Income Groups especially through digital platforms for Income Generating Purposes’ (Financial Services).
By mapping the overlaps and gaps between public sector priorities and private sector interest, the SDG Investor Map lays out pathways that can bring together private-sector investment and public sector support for 6 SDG-enabling sectors including Education, Healthcare, Agriculture & Allied Activities, Financial Services, Renewable Energy & Alternatives and Sustainable Environment. These sectors and the IOAs within them were selected through a rigorous analytical process that included extensive consultations with a number of major domestic and international investors, government stakeholders and think-tanks. This ensured that the Map’s findings were truly reflective of market sentiment.
Disclaimer: We donot claim that the images used as part of the news published are always owned by us. From time to time, we use images sourced as part of news or any related images or representations. Kindly take a look at our image usage policy on how we select the image that are used as part of the news.


