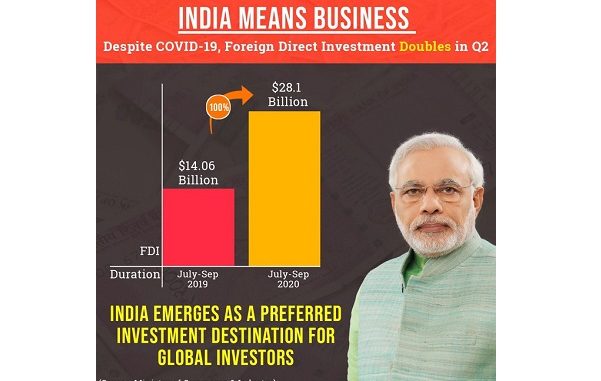
Nov 28: Total Foreign Direct Investments (FDI) inflows into India during the second quarter of the financial year 2020-21 (July 2020 to September 2020) have been US$ 28,102 million, out of which FDI equity inflows were US$ 23,441 million or Rs. 174,793 crore. This takes the FDI equity inflows during the financial year 2020-21upto September 2020 to US$30,004 million which is 15% more than the corresponding period of 2019-20. In rupee terms, the FDI Equity inflows of Rs 224,613 Crore are 23% more than the last year. August, 2020 has been the significant month when US$ 17,487 Million FDI equity inflows were reported in the country.
| Financial Year 2020-21( April – September) | Amount of FDI Equity inflows | ||
| (In Rs. Crore) | (In US$ mn) | ||
| 1. | April, 2020 | 21,133 | 2,772 |
| 2. | May, 2020 | 16,951 | 2,240 |
| 3. | June, 2020 | 11,736 | 1,550 |
| 4. | July, 2020 | 22,866 | 3,049 |
| 5. | August, 2020 | 130,576 | 17,487 |
| 6. | September, 2020 | 21,350 | 2,906 |
| 2020-21 (form April, 2020 to September, 2020) # | 224,613 | 30,004 | |
| 2019-20 (form April, 2019 to September, 2019) # | 182,000 | 26,096 | |
| %age growth over last year | (+) 23% | (+) 15% |
# Figures are provisional, subject to reconciliation with RBI, Mumbai.
In terms of the Countries from where FDI Equity Inflows were reported to India, during April, 2000 to September, 2020; maximum FDI Equity inflows have been reported from Mauritius, followed by Singapore and the USA.
SHARE OF TOP INVESTING COUNTRIES FDI EQUITY INFLOWS (Financialyears):
Amount in Rupees Crores (in US$ Million)
| Rank s | Country | 2018-19(April – March) | 2019-20(April – March) | 2020-21(April – September) | CumulativeInflows (April, 00 –September,20) | %age to total Inflows (intermsof US$) |
| 1. | MAURITIUS | 57,139 | 57,785 | 15,019 | 810,960 | 29% |
| (8,084) | (8,241) | (2,003) | (144,713) | |||
| 2. | SINGAPORE | 112,362 | 103,615 | 62,084 | 671,646 | 21% |
| (16,228) | (14,671) | (8,301) | (105,970) | |||
| 3. | U.S.A. | 22,335 | 29,850 | 53,266 | 229,488 | 7% |
| (3,139) | (4,223) | (7,123) | (36,902) | |||
| 4. | NETHERLANDS | 27,036 | 46,071 | 11,306 | 219,628 | 7% |
| (3,870) | (6,500) | (1,498) | (35,350) | |||
| 5. | JAPAN | 20,556 | 22,774 | 4,932 | 201,037 | 7% |
| (2,965) | (3,226) | (653) | (34,152) | |||
| 6. | U.K. | 9,352 | 10,041 | 10,155 | 160,566 | 6% |
| (1,351) | (1,422) | (1,352) | (29,563) | |||
| 7. | GERMANY | 6,187 | 3,467 | 1,498 | 70,442 | 2% |
| (886) | (488) | (202) | (12,398) | |||
| 8. | CYPRUS | 2,134 | 6,449 | 355 | 58,348 | 2% |
| (296) | (879) | (48) | (10,796) | |||
| 9. | FRANCE | 2,890 | 13,686 | 8,494 | 59,005 | 2% |
| (406) | (1,896) | (1,135) | (9,675) | |||
| 10. | CAYMAN ISLANDS | 7,147 | 26,397 | 15,672 | 65,520 | 2% |
| (1,008) | (3,702) | (2,103) | (9,639) | |||
| TOTAL FDI EQUITY INFLOWS FROM ALL COUNTRIES * | 309,867(44,366) | 353,558(49,977) | 224,613(30,004) | 2,957,057(500,123) | – |
Among the sectors, Services sector has received maximum FDI equity inflows, during April, 2000 to September, 2020; followed by Computer Software & Hardware, and Telecommunications.
SECTORS ATTRACTING HIGHEST FDI EQUITY INFLOWS:
Amount in Rs. Crores (in US$ Million)
| Ranks | Sector | 2018-19(April – March) | 2019-20(April – March) | 2020-21(April – September) | CumulativeInflows (April, 00 –September, 20) | % age to total Inflows (In terms ofUS$) |
| 1. | SERVICES SECTOR ** | 63,909(9,158) | 55,429(7,854) | 16,955(2,252) | 488,685(84,255) | 17% |
| 2. | COMPUTER SOFTWARE & HARDWARE | 45,297(6,415) | 54,250(7,673) | 131,169(17,554) | 407,175(62,466) | 12% |
| 3 | TELECOMMUNICATIONS | 18,337(2,668) | 30,940(4,445) | 50(7) | 219,238(37,278) | 7% |
| 4. | TRADING | 30,963(4,462) | 32,406(4,574) | 7,140(949) | 183,145(28,543) | 6% |
| 5. | CONSTRUCTION DEVELOPMENT:Townships, housing, built-up infrastructure and construction- development projects | 1,503(213) | 4,350(617) | 887(118) | 124,851(25,780) | 5% |
| 6. | AUTOMOBILE INDUSTRY | 18,309(2,623) | 19,753(2,824) | 3,162(417) | 146,904(24,628) | 5% |
| 7. | CHEMICALS (OTHER THAN FERTILIZERS) | 13,685(1,981) | 7,492(1,058) | 3,287(437) | 101,842(18,077) | 4% |
| 8. | CONSTRUCTION (INFRASTRUCTURE) ACTIVITIES | 15,927(2,258) | 14,510(2,042) | 2,814(377) | 111,197(17,223) | 3% |
| 9. | DRUGS & PHARMACEUTICALS | 1,842(266) | 3,650(518) | 2,715(367) | 90,529(16,868) | 3% |
| 10. | HOTEL & TOURISM | 7,590(1,076) | 21,060(2,938) | 2,128(283) | 93,907(15,572) | 3% |
Gujarat has been the major beneficiary state of the FDI Equity inflows, during October, 2019 to September, 2020;followed by Maharashtra and Karnataka.
STATES/UTs ATTRACTING HIGHEST FDI EQUITYINFLOWS
Amount in Rupees Crores (in US$ Million)
| S.No. | STATE | 2019-20(October – March) | 2020-21(April – September) | CumulativeInflows (October, 19-September,20) | %age to total Inflows(in terms of US$) |
| 1 | GUJARAT | 18,964 | 1,19,566 | 1,38,530 | 35% |
| (2,591) | (16,005) | (18,596) | |||
| 2 | MAHARASHTRA | 52,073 | 27,143 | 79,216 | 20% |
| (7,263) | (3,619) | (10,882) | |||
| 3 | KARNATAKA | 30,746 | 27,458 | 58,204 | 15% |
| (4,289) | (3,660) | (7,949) | |||
| 4 | DELHI | 28,487 | 19,863 | 48,350 | 12% |
| (3,973) | (2,663) | (6,635) | |||
| 5 | JHARKHAND | 13,208 | 5,990 | 19,198 | 5% |
| (1,852) | (792) | (2,644) | |||
| 6 | TAMIL NADU | 7,230 | 7,062 | 14,292 | 4% |
| (1,006) | (938) | (1,944) | |||
| 7 | HARYANA | 5,198 | 5,111 | 10,310 | 3% |
| (726) | (682) | (1,408) | |||
| 8 | TELANGANA | 4,865 | 5,045 | 9,910 | 3% |
| (680) | (668) | (1,348) | |||
| 9 | UTTAR PRADESH | 1,738 | 1,680 | 3,418 | 1% |
| (243) | (225) | (468) | |||
| 10 | WEST BENGAL | 1,363(190) | 1,985(261) | 3,348(451) | 1% |


